目次
1. Summary
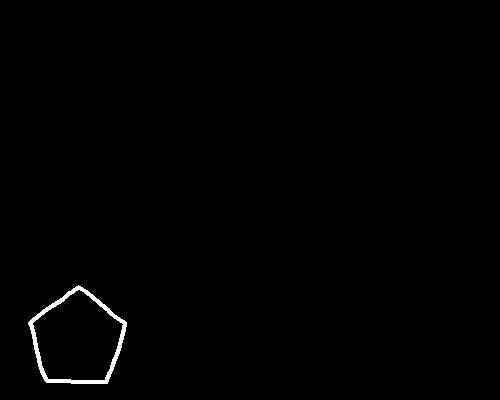
I would like to introduce the method of extracting the red line drawn in the following image by image processing using Python and OpenCV.
Furthermore, I would like to introduce how to output the extracted red line coordinate values to a CSV file and how to perform folder processing that processes multiple images in succession.

2. Environment
- OS : Windows10 64bit
- OpenCV :4.1.0
Please refere this link to see how to install python-opencv. - IDE : Spyder
3. Image Processing
Let’s see the python code!
#import libraries
import numpy as np
from matplotlib import pyplot as plt
import os
import skimage
from skimage import io
from tqdm import tqdm
import glob
import cv2
import csv

#Specify the image file directory to be input and the output destination directory
#process the images in "root folder" - "data folder" - "image folder"
#output into "root folder" - "data folder" - "result folder"
#"root folder" stands for the folder you save the ".py" file in.
path="data/"
input_dir="image"
output_dir="result"

#make full path
all_files=glob.glob(os.path.join(path,input_dir,"**/*.*"),recursive=True)

#create csv file
csvfile = open("np_csv_test.csv", "w")

#loop processing
for i,filepath in tqdm(enumerate(all_files)):

    #read image with OpenCV
    src = cv2.imread(filepath)

    #Define the red color in RGB
    #lower = (0, 0, 200)
    #upper = (50, 50, 255)
    #Note, channel in OpenCV is BGR. And lower, upper threshold needs to be define from Blue, Green, Red respectively.
    #You can change these value if you want to.
    dst = cv2.inRange(src, (0, 0, 200), (50, 50, 255))

     #extract imagefilename.bmp from finename
    filename = filepath.rsplit("\\")[1]
    #Make full path
    outputimage = path + output_dir +"/" + "Extracted_redline_" + filename
    cv2.imwrite(outputimage, dst)

    #Extract (x,y) coordinate (value) from RED lines.
    #Note, in this script, np.where() is used.
    #Merge X and Y with np.dstack() method because the return from np.where() is separated.
    #indices = np.dstack(np.where(dst == 255)) #This is going to be an error, I don't know why.
    indices = np.where(dst == 255) #Return values are Y,X in sequence. Be careful if you want to make an graph in EXCEL.

    outputcsv = path + output_dir +"/" + "result.csv";

    #Note, eveytime you execute, csv file will be overwritten.
    y = indices[0]
    y1 = y.reshape(1, y.size)
    x = indices[1]
    x1 = x.reshape(1, x.size)
    axis = np.arange(x.size)
    axis = axis.reshape(1, axis.size)
    with open(outputcsv, 'ab') as f:
        np.savetxt(f, filepath.rsplit("\\"), fmt="%s", delimiter = ",")
        np.savetxt(f, axis, fmt="%.0d", delimiter = ",")
        np.savetxt(f, x1, fmt="%.0d", delimiter = ",")
        np.savetxt(f, y1, fmt="%.0d", delimiter = ",")

#Close csv file
csvfile.close()
4. Result
4.1 Input images
A heart, star, pentagon-shaped with red line will be processed.


4.2 Extracted result
The red line on the heart, star, pentagon-shaped is extracted.


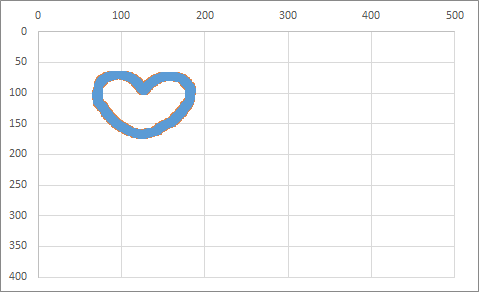
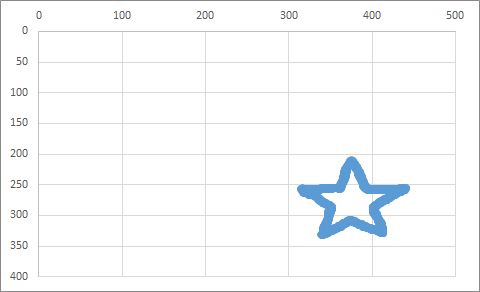
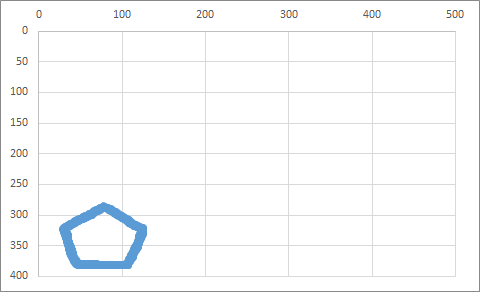
4.3 Exported result
Graph in EXCEL is made.
The coordinates (X, Y) of each pixel that forms the line are output, so it is the same as the image.
コメント