目次
概要
Pythonでブロブの幅計測を行います。
画像処理をやっていると、対象となるブロブの幅(やブロブの長さ、ブロブの面積などの)計測を行いたいことは多々あります。
ブロブの幅計測は、OpenCVに実装されているラベリング処理(connectedComponentsWithStats)でも幅計測可能だと思いますが、今回は輪郭を見つけるContour処理を用いて、ブロブの幅計測を行います。
今後、この処理をRaspberry Piに実装して工程監視に使いたいと思っているので、Pythonで構築してみました。
環境
- OS : Windows10 64bit
- 画像処理ライブラリ: OpenCV
- 使用言語 : Python (IDEはSpyderを使用)
処理内容
処理の流れは以下の通りです。
- 処理画像を読み込む
- 二値化処理
- 輪郭抽出処理
- 輪郭の座標抽出
- 出力
以下にpythonのスクリプトを載せておきます。
#必要なライブラリのインポート import cv2 import numpy as np import matplotlib.pyplot as plt #画像読み込み src = cv2.imread('image1.png') #入力画像を描画 plt.imshow(src) #グレー画像に変換 gray = cv2.cvtColor(src, cv2.COLOR_BGR2GRAY) #前処理(必要であれば実行する。ガウシアンフィルタでノイズ除去) preprocessed = cv2.GaussianBlur(gray, (5, 5), 0) #二値化処理 _, binary = cv2.threshold(preprocessed, 130, 255, cv2.THRESH_BINARY) #白黒反転処理 #openCVでは白側が処理対象となるため binary_inv = cv2.bitwise_not(binary) #二値画像を描画 plt.imshow(binary_inv,plt.cm.gray) # 輪郭を見つける contours, _ = cv2.findContours(binary_inv, cv2.RETR_EXTERNAL, cv2.CHAIN_APPROX_SIMPLE) # matをコピー blob_and_contours = np.copy(src) # 輪郭の選択 min_area = 60 large_contours = [cnt for cnt in contours if cv2.contourArea(cnt) > min_area] # 輪郭を描画した配列を作成 cv2.drawContours(blob_and_contours, large_contours, -1, (255,0,0)) # 輪郭の個数を出力 print('ブロブの数: %d' % len(large_contours)) #画像と輪郭を描画 plt.imshow(blob_and_contours) #外接矩形 #matをコピー bounding_img = np.copy(src) # for each contour find bounding box and draw rectangle for contour in large_contours: #x,y = contourの左上のx,y座標 #w,h = contourの幅と高さ(長さ) x, y, w, h = cv2.boundingRect(contour) cv2.rectangle(bounding_img, (x, y), (x + w, y + h), (0, 255, 0), 3) #画像と外接矩形を描画 plt.imshow(bounding_img) print('幅:', w)以下の部分では、画像内に複数のブロブが存在する場合、幅を計測したい輪郭のみを抽出する処理を入れています。
(HALCONでいうところの、select_shape処理です)# 輪郭の選択 min_area = 60 large_contours = [cnt for cnt in contours if cv2.contourArea(cnt) > min_area]処理結果
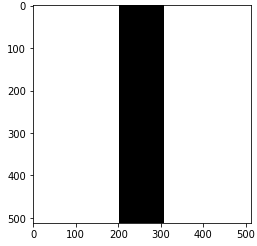
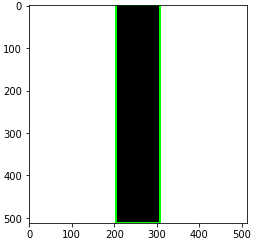
処理画像と出力画像をいかに示します。
出力画像の中の緑色の枠が抽出した輪郭(contour)です。
出力画像(blob_and_contours)


コメント